SwissEnergyCharts provides comprehensive energy market and production data, including real-time and historical insights into electricity generation, renewable contributions, and emissions. The data can be accesssed via a open and free API endpoint.
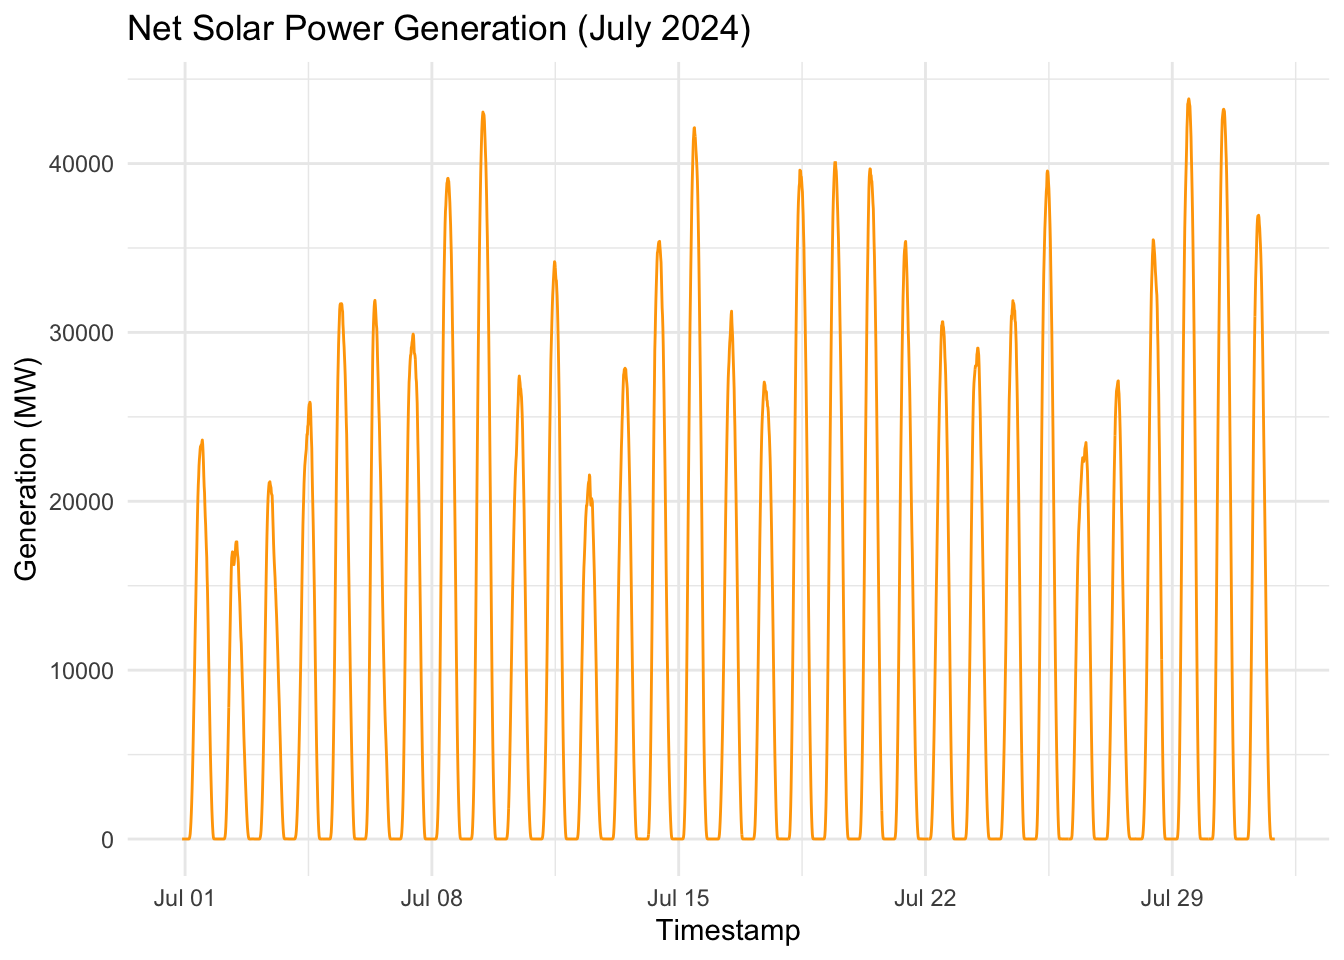
4.1.1.1 Example of Querying the Solar production data for Switzerland
Show Code
# Define base parametersbase_url<-"https://api.energy-charts.info/public_power"power_type<-"Solar"start_date<-as.Date("2024-07-01")end_date<-as.Date("2024-07-31")# Function to fetch solar generation datafetch_solar_generation<-function(base_url, power_type, start_date, end_date){query_url<-paste0(base_url,"?type=", power_type,"&start=", format(start_date, "%Y-%m-%d"),"&end=", format(end_date, "%Y-%m-%d"))response<-httr::GET(query_url, add_headers("accept"="application/json"))if(httr::http_status(response)$category=="Success"){data<-httr::content(response, as ="text", encoding ="UTF-8")parsed_data<-jsonlite::fromJSON(data)# Extract timestamps and production datatimestamps<-parsed_data$unix_secondsproduction_data<-parsed_data$production_types%>%dplyr::filter(name==power_type)%>%dplyr::pull(data)%>%unlist()# Combine into a data frameif(!is.null(timestamps)&&!is.null(production_data)){df<-data.frame( timestamp =as.POSIXct(timestamps, origin ="1970-01-01", tz ="UTC"), generation =production_data)return(df)}else{stop("Production data or timestamps are missing in the API response.")}return(df)}else{stop("Failed to fetch data: ", http_status(response)$message)}}# Fetch the solar generation datasolar_data<-fetch_solar_generation(base_url, power_type, start_date, end_date)# Plot the solar generation data for visualizationggplot(solar_data, aes(x =timestamp, y =generation))+geom_line(color ="orange")+labs( title ="Net Solar Power Generation (July 2024)", x ="Timestamp", y ="Generation (MW)")+theme_minimal()
You can explore SwissEnergyCharts’ API documentation for details on available endpoints, parameters, and response formats.
4.1.2 Energy Market Data
SwissEnergyCharts provides comprehensive energy market and production data, including real-time and historical insights into electricity generation, renewable contributions, and emissions. The data can be accesssed via a open and free API endpoint.
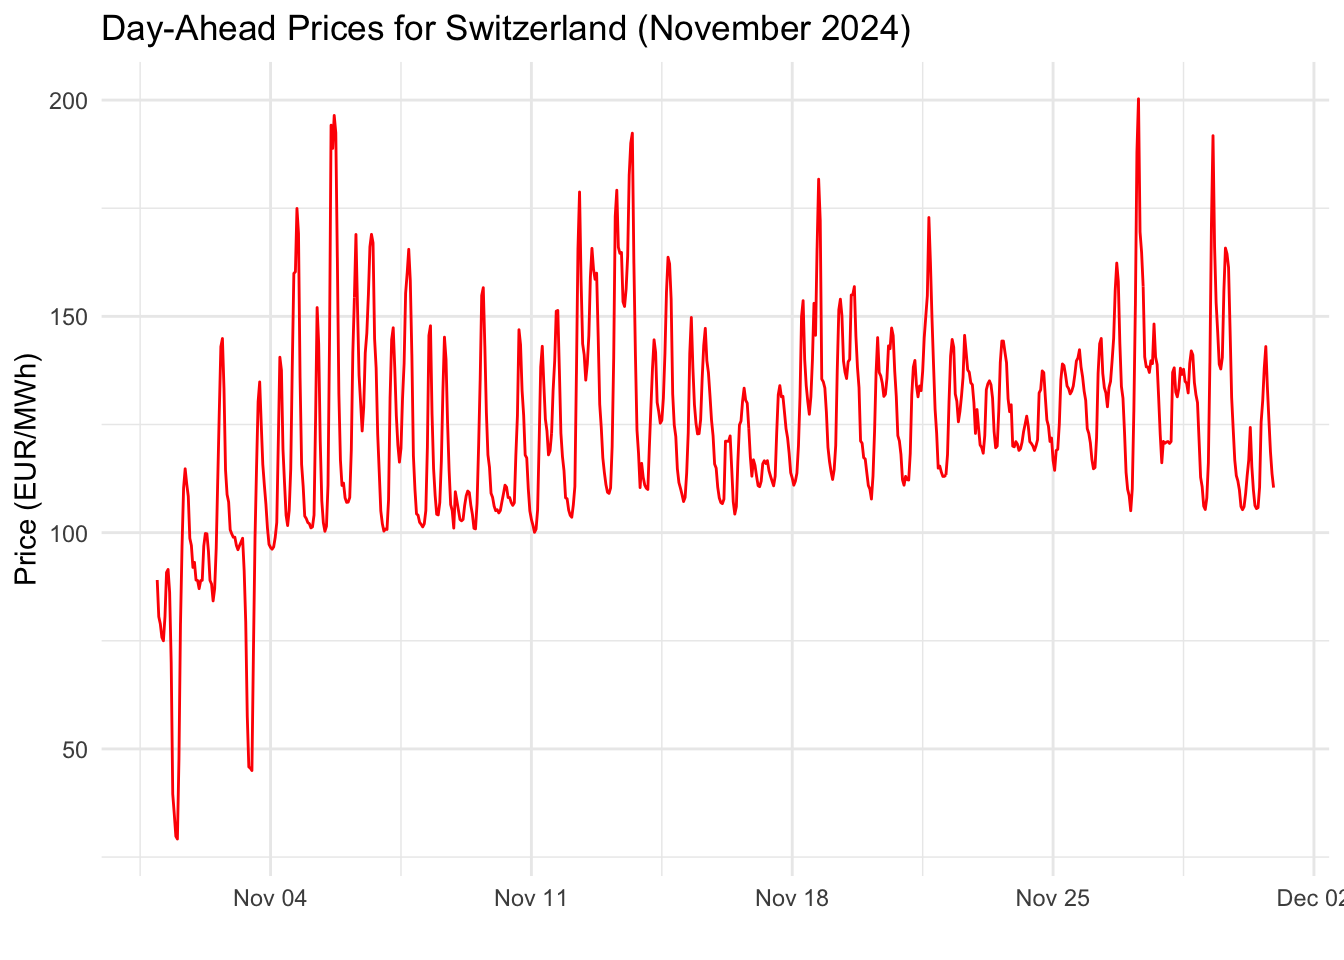
4.1.2.1 Example of Querying the Day-Ahead Prices for Switzerland
Show Code
# Define base parametersbase_url<-"https://api.energy-charts.info/price"bidding_zone<-"CH"start_date<-as.Date("2024-11-01")end_date<-as.Date("2024-11-30")# Function to fetch data from the APIfetch_prices<-function(base_url, bidding_zone, start_date, end_date){query_url<-paste0(base_url,"?bzn=", bidding_zone,"&start=", format(start_date, "%Y-%m-%d"),"&end=", format(end_date, "%Y-%m-%d"))response<-httr::GET(query_url, add_headers("accept"="application/json"))if(http_status(response)$category=="Success"){data<-content(response, as ="text", encoding ="UTF-8")parsed_data<-fromJSON(data)df<-data.frame( timestamp =as.POSIXct(parsed_data$unix_seconds, origin ="1970-01-01", tz ="UTC"), price =parsed_data$price)return(df)}else{stop("Failed to fetch data: ", http_status(response)$message)}}# Fetch the price dataprice_data<-fetch_prices(base_url, bidding_zone, start_date, end_date)# Plot the pricesggplot2::ggplot(price_data, aes(x =timestamp, y =price))+geom_line(color="#FF0000")+labs( title ="Day-Ahead Prices for Switzerland (November 2024)", x ="", y ="Price (EUR/MWh)")+theme_minimal()
You can explore SwissEnergyCharts’ API documentation for details on available endpoints, parameters, and response formats.
4.1.3 Weather Data
Meteomatics provides a high-resolution Weather API with global coverage and extensive parameters, such as temperature, wind, solar radiation, and precipitation. We obtained a free test access.
Example: Fetching Solar Radiation Data
curl-X GET "https://api.meteomatics.com/solar_radiation/2024-12-14T00:00:00Z--2024-12-14T23:59:59Z:P1H/46.94809,7.44744/json"\-u "username:password"
By integrating these powerful data sources into their systems, energy utility companies can achieve higher forecasting accuracy, optimize grid operations, and support the energy transition effectively.